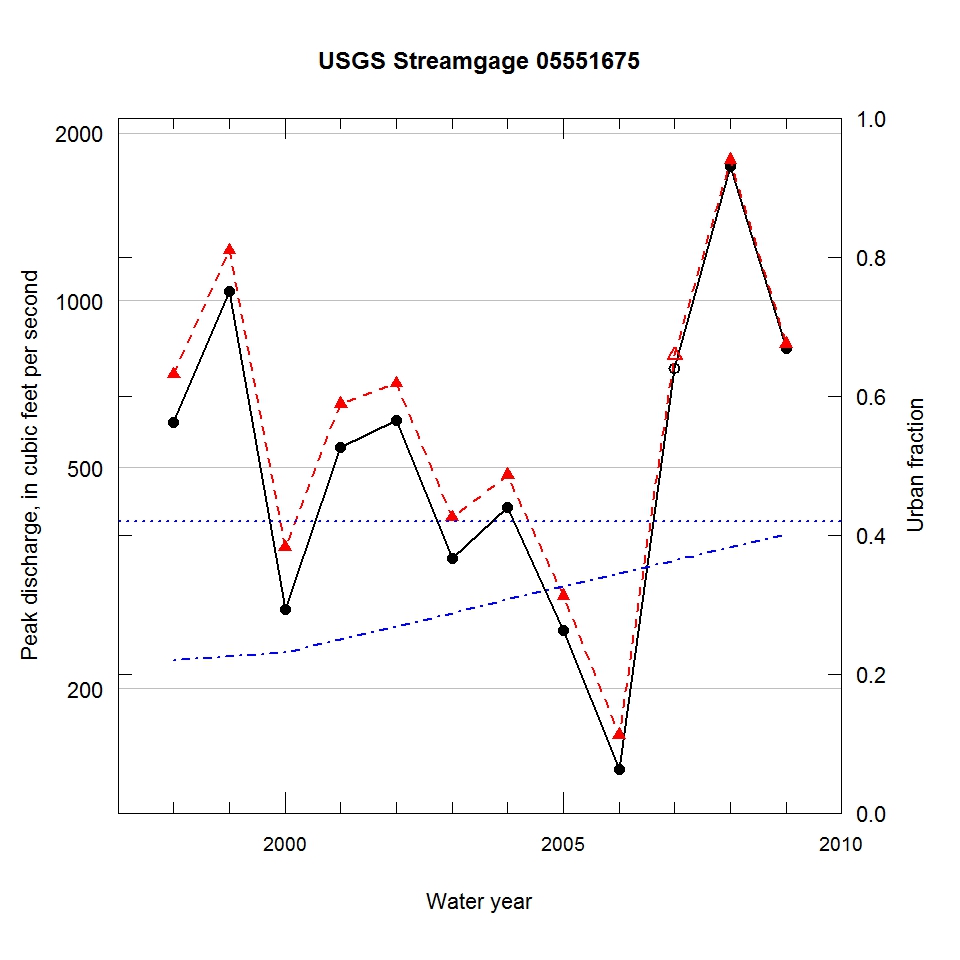
Observed and urbanization-adjusted annual maximum peak discharge and associated urban fraction and precipitation values at USGS streamgage:
05551675 BLACKBERRY CREEK NEAR MONTGOMERY, IL


| Water year | Segment | Discharge code | Cumulative reservoir storage (acre-feet) | Urban fraction | Precipitation (inches) | Observed peak discharge (ft3/s) | Adjusted peak discharge (ft3/s) | Exceedance probability |
| 1998 | 1 | C | 283 | 0.219 | 0.863 | 603 | 736 | 0.291 |
| 1999 | 1 | C | 283 | 0.225 | 1.128 | 1040 | 1230 | 0.062 |
| 2000 | 1 | C | 283 | 0.231 | 1.578 | 278 | 359 | 0.802 |
| 2001 | 1 | C | 283 | 0.250 | 0.664 | 544 | 652 | 0.386 |
| 2002 | 1 | C | 438 | 0.269 | 1.553 | 608 | 709 | 0.320 |
| 2003 | 1 | CE | 438 | 0.288 | 1.009 | 344 | 407 | 0.739 |
| 2004 | 1 | CE | 438 | 0.307 | 1.608 | 425 | 485 | 0.623 |
| 2005 | 1 | CE | 438 | 0.325 | 0.746 | 255 | 294 | 0.879 |
| 2006 | 1 | CE | 633 | 0.344 | 0.902 | 143 | 165 | 0.967 |
| 2007 | 1 | 7C | 633 | 0.363 | 0.513 | 754 | 796 | 0.236 |
| 2008 | 1 | C | 1114 | 0.382 | 4.117 | 1740 | 1790 | 0.018 |
| 2009 | 1 | C | 1114 | 0.401 | 0.902 | 821 | 836 | 0.204 |

